December 16, 2025

The PairX system is a complete suite of trading tools built to give everyday traders the same analysis professionals rely on. It takes complex market data and translates it into simple color coded concepts that show trend strength and momentum in real time. Instead of guessing or blindly following influencer trades, PairX helps you understand price action for yourself.
Many well intentioned traders don’t fail from lack of effort; they fail because their interpretation of the market isn’t consistent. They react on emotion and guesses, never seeing the bigger picture. Our solution? Formulas that stay the same under the hood so that your guiding principles become color and symbol recognition.
"Think of it as a trading GPS. It confirms when you're on the right path,
warns you as conditions shift, and highlights the highest probability
routes forward. When the path is clear consistency becomes possible."
Together, they give you a reliable read on the market so you can make faster, more informed decisions. PairX takes the uninformed beginner, likely gambling on trades, into one that competes at the highest level with tools that give you a chance to think like a pro. Trade with confidence, whether you're trading part time or planning your escape from the 9 to 5, PairX is your shortcut to playing this game for keeps.
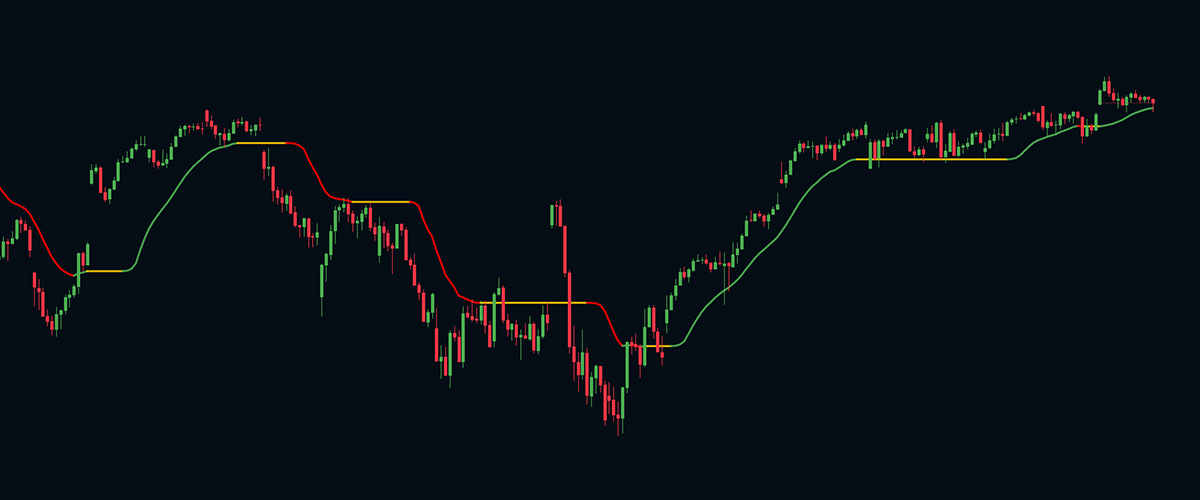
CoreX™ helps visualize the market’s direction while also acting as a dynamic level of support and resistance. As price moves, Our Core Line adapts, guiding your view of trend strength and potential turning points.
CoreX Line shifts colors based on trend strength:
When the price is above a green Core Line, conditions are typically bullish. When it’s below a red Core Line, sentiment often leans bearish. The line itself often reacts as a barrier where price may bounce off it in an uptrend or reject from it in a downtrend.
In strong trends, the Core Line often acts as a dynamic floor or ceiling, helping confirm continuation or signaling when momentum is fading. Watching how price interacts with it, whether a bounce or rejection can offer valuable timing insight.
The Core Line comes with three tuning levels. Low, Medium, and High, so you can match the sensitivity to the asset or timeframe you're trading. The best setting is often the one that’s most respected historically on the chart you're analyzing.
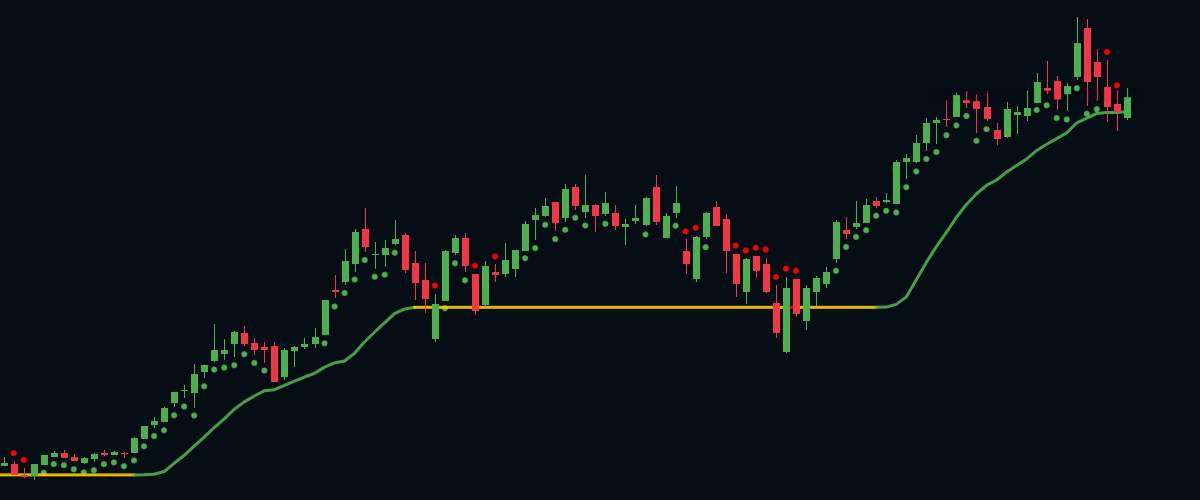
The PulseX™ Dots are the first to react when momentum starts to shift. They track subtle changes in market structure, often showing signs of reversal before the bigger picture adjusts. That makes them valuable for timing both entries and exits when used with discipline.
These markers are also powerful as confirmation signals. When aligned with other tools in the PairX suite like Reversal or Top signals they add conviction to a setup.
The dots have three states, green for bullish, neutral (no dot) to caution the loss of a trend and red as bearish.

The TrendX™ Bars are designed to track broader high conviction market trends so you can catch the moves that matter and ignore the noise. Unlike fast flipping indicators, the Trend Bars don't react to every price adjustment. It’s built to hold its stance longer, making it ideal for identifying major uptrends and downtrends with fewer false starts.
Because of that, the Flow bars help you stay in strong moves and avoid getting shaken out during temporary rallies or short-term pullbacks. Combined with PulseX Dots and CoreX lines, it gives you a complete top down view of market direction, from early signals to full confirmation.

Reversal Signals appear when price action suggests a directional shift may be underway from bullish to bearish or the other way around. These signals are designed to alert you to potential turning points.
A reversal signal is considered confirmed when 1 of the next two bars closes above the originations bar top wick (if it is a bullish reversal) or below the origination bars bottom wick (if it is a bearish reversal). It is often true that if a reversal signal fails to confirm the opposite of the signal takes place.
These signals have two states when they trigger, blue when bullish and yellow when bearish. You will also notice that all bearish signals are posted above the candles while bullish signals are positioned below. This remains consistent throughout the PairX suite.
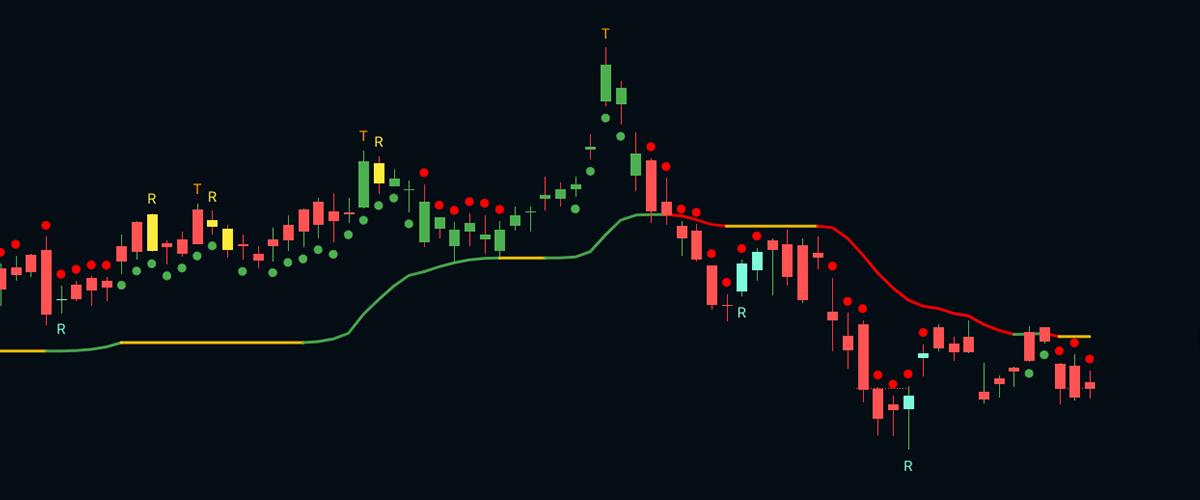
A potential top appears when you see an orange bar with an orange “T” above it. This marks areas where price has pushed up for an extended move and is now showing signs of stalling. These often act as short-term tops, but they can also be the early warning signs of a much bigger macro reversal, so they’re worth paying close attention to.
Topping signals follow the same confirmation logic as reversals. Because this setup points to bearish momentum, the candle that forms after the topping bar must close below the bottom wick of the topping bar. Only then is the top confirmed.